May 2024 Market Update
Quarterly Market Summary and Long-Term Market Summary
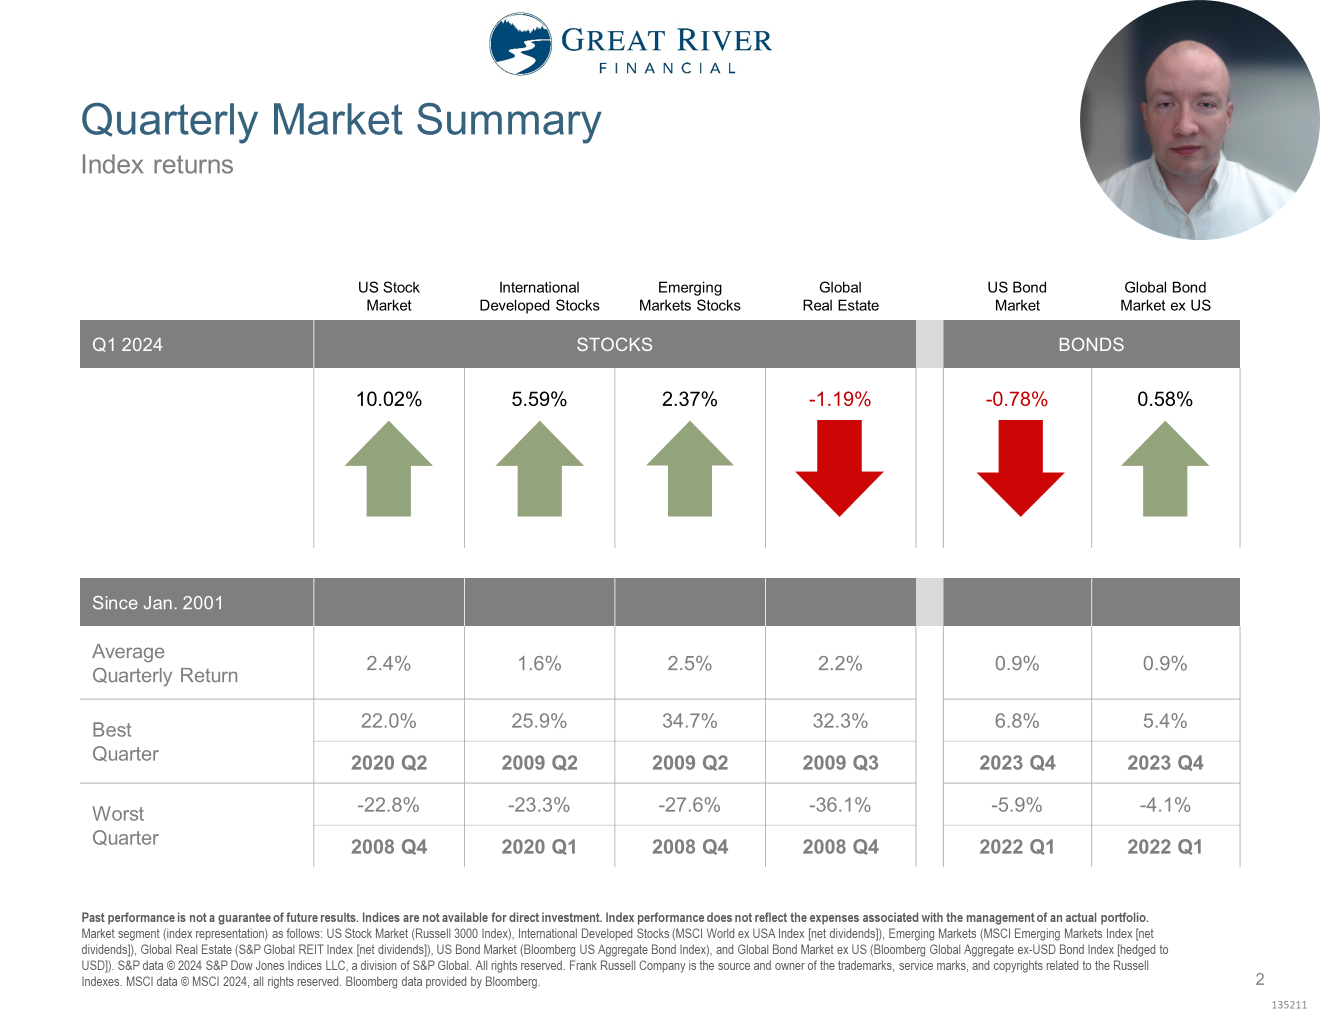
Stocks did well around the world with US Stocks being up over 10% and International Stocks being up over 2% to almost 6%. Inflation stayed persistent, which led to higher interest rates, which hurts both Real Estate, as well as International and US bonds, which were all below their long-term averages for the quarter.
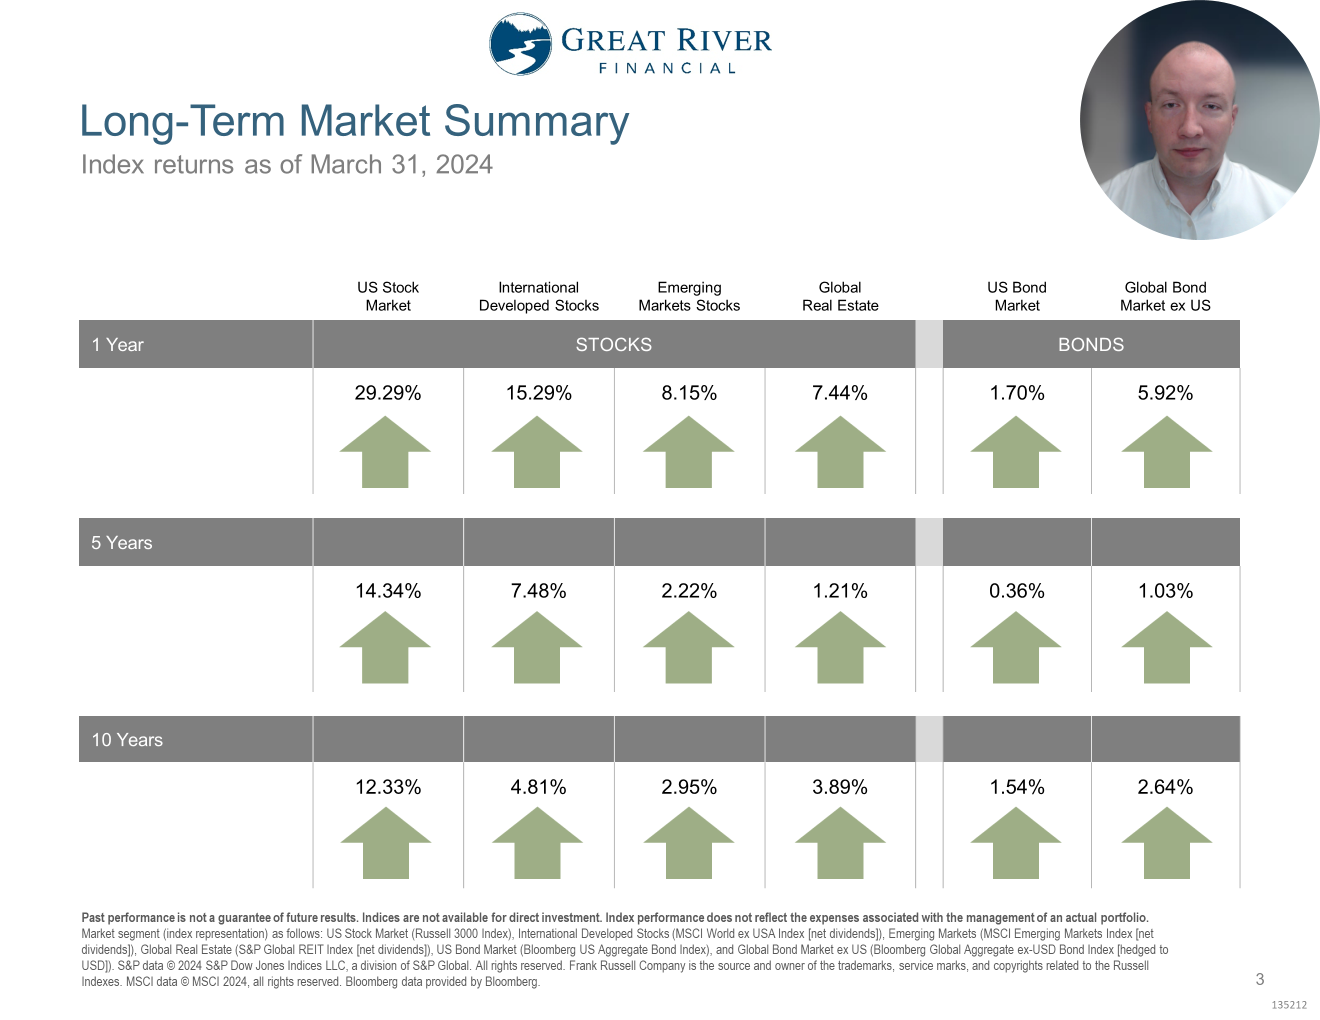
When we look at the last year stocks did well around the world, but particularly large companies (in advanced economies) the US Stock Market was up over 29% in the last 12 months and International Developed Markets were up over 15%. When we look at bonds, too, they were both positive US and International, but particularly International was above its long-term averages over the last 12 months.
When we look at the last year stocks did well around the world, but particularly large companies (in advanced economies) the US Stock Market was up over 29% in the last 12 months and International Developed Markets were up over 15%. When we look at bonds, too, they were both positive US and International, but particularly International was above its long-term averages over the last 12 months.
History Doesn’t Repeat Itself, but it does Rhyme
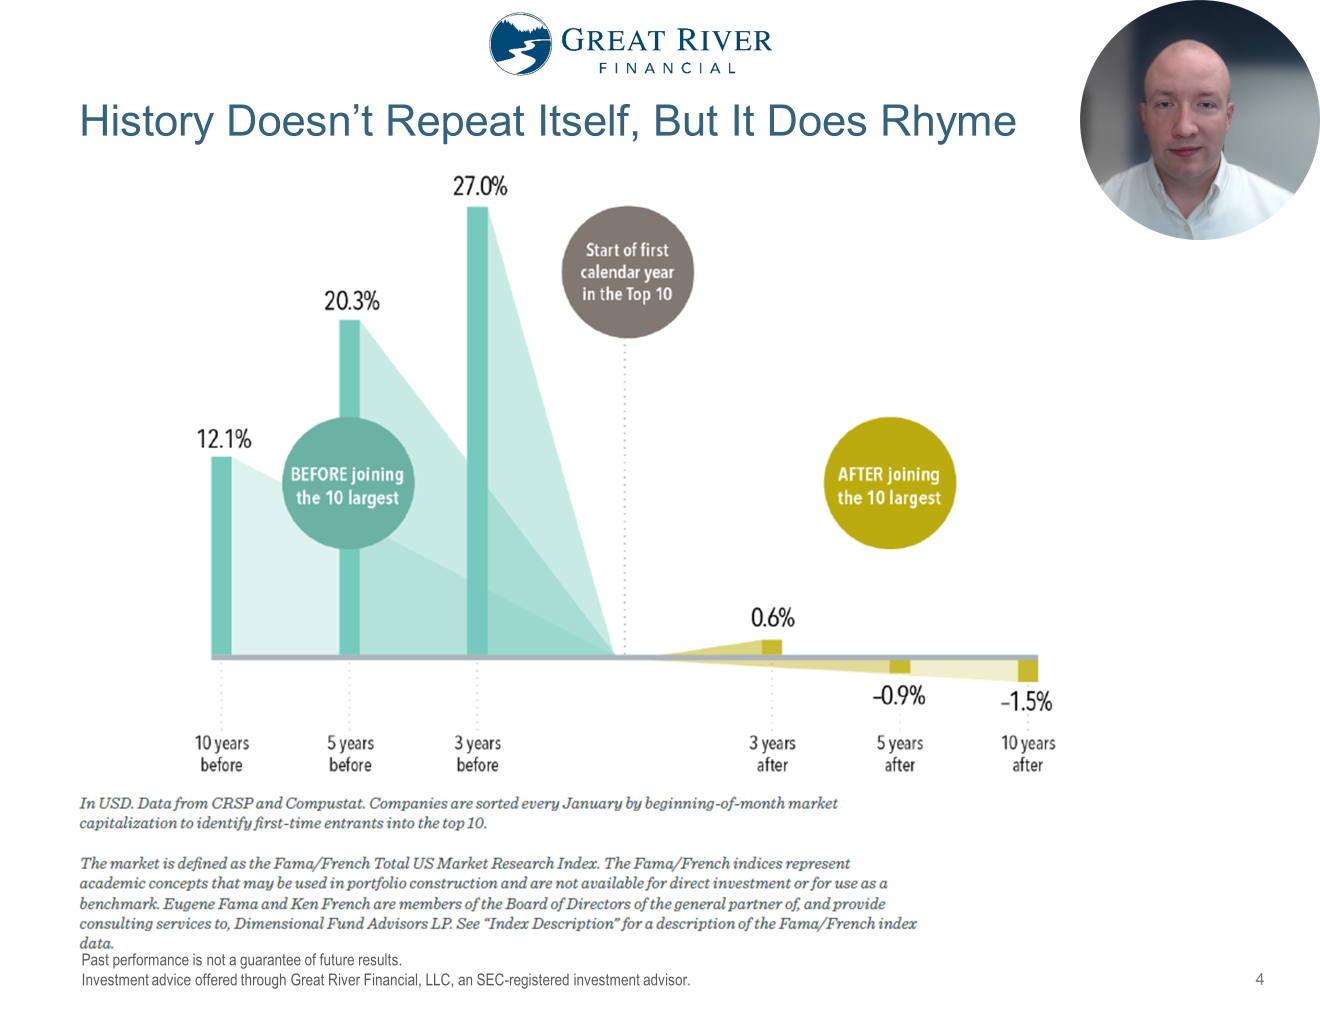
It’s natural for our attention to be drawn to Investments that are outperforming in any given period. This was true of real estate in the middle 2000s, internet companies in the late 90s, and energy companies in the 70s. Right now, large technology companies with artificial intelligence offerings are doing much better than average. What this graph shows is when a company becomes one of the 10 largest companies in the country that the prior period they tended to outperform pretty dramatically in order to pass all the companies that they did in order to get in the top 10. But, after they get in the top 10 largest companies they tend to underperform. Now 1.5% per year underperformance that doesn’t mean negative performance, but underperformance of the benchmark for a 10-year period adds up to over 15% under performance, which is the difference between $2.3 million and $2 million.
The S&P 500 Excludes Some Large Companies
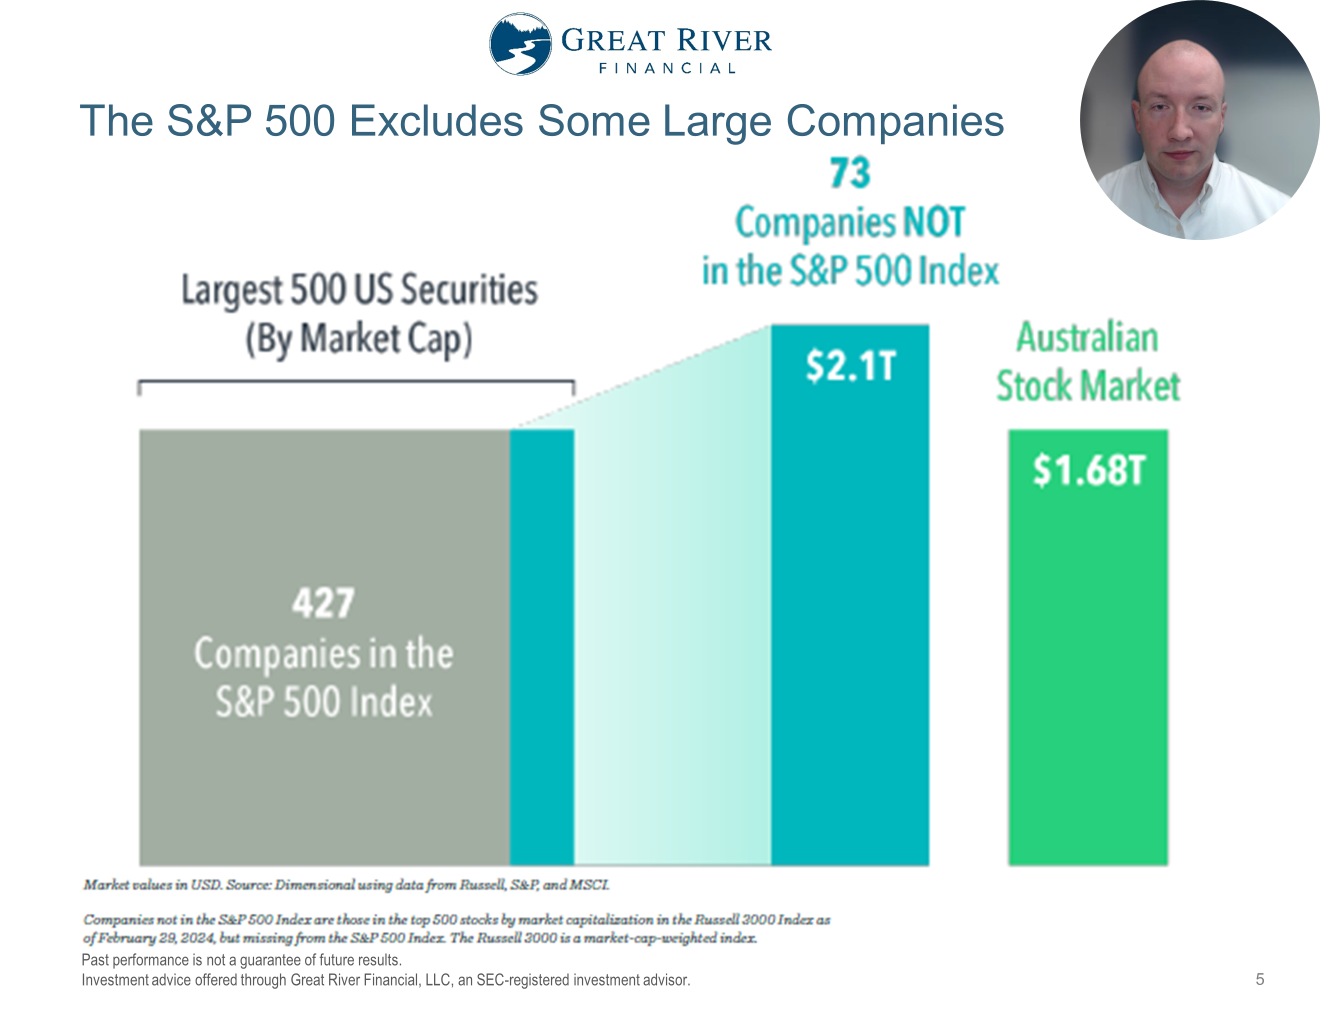
When people talk about the US Stock Market a lot of times they’re thinking about the S&P 500 and while the S&P 500 makes up a large portion of the US Stock Market there’s a lot of value in innovative companies outside the S&P 500. For instance, when we look at the 500 largest companies by total market cap 73 of them are not in the S&P 500 Index, which represents over $2.1 trillion worth of total market value. Now to put that in context that’s more than 23% larger than the entire Australian stock market, so it’s important that we don’t overlook the companies that may be the next Google or Invidia.
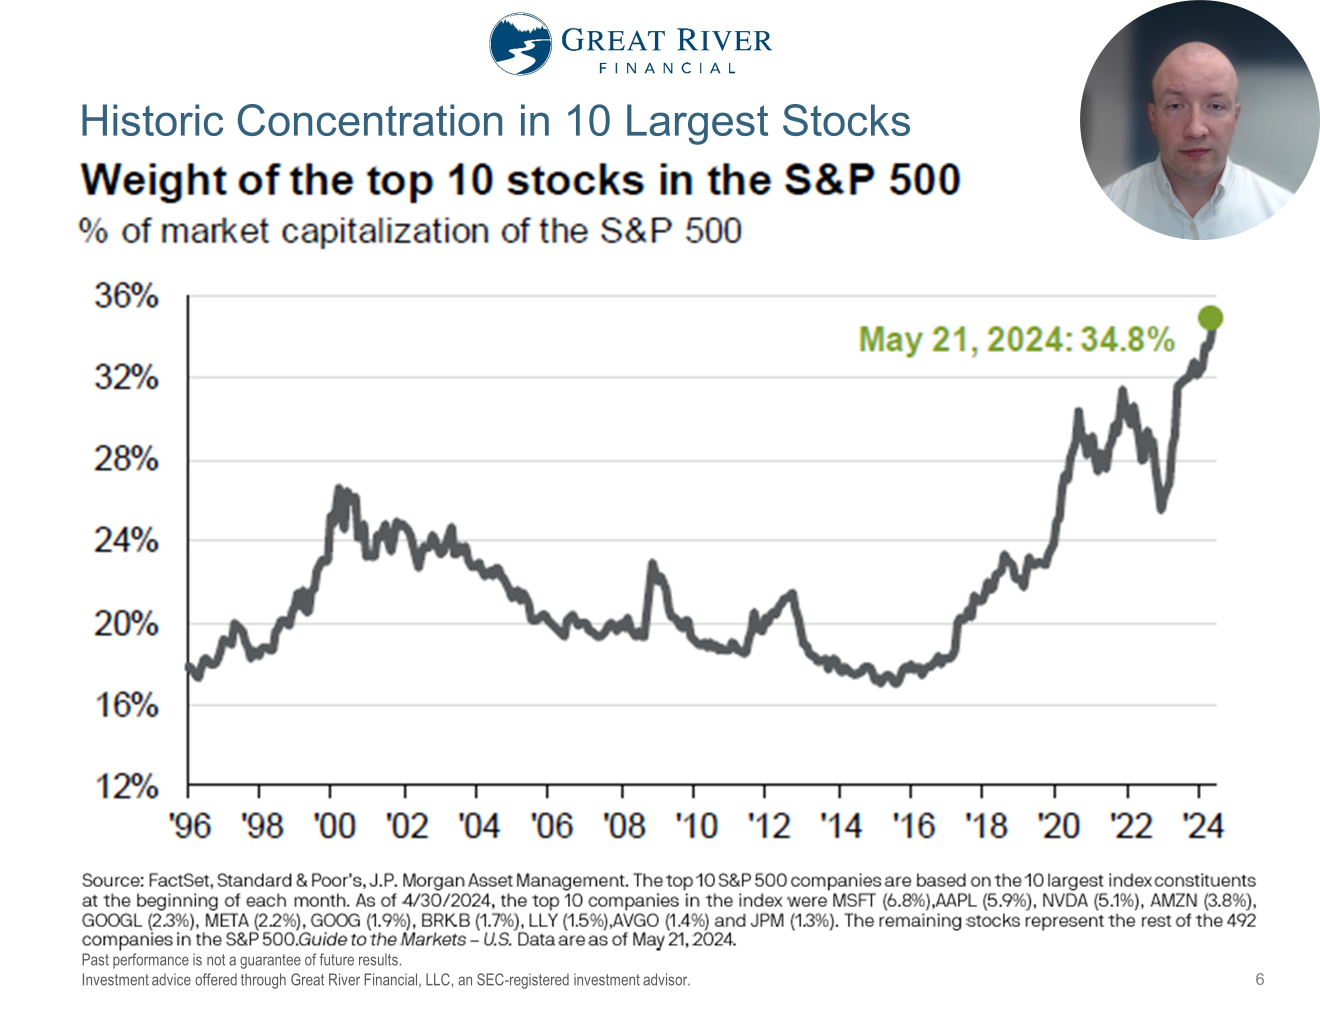
Historic Concentration in 10 Largest Stocks
The top 10 stocks in the S&P 500 have a larger percentage of that index than at any point in the last 30 years. Now this doesn’t mean that we expect those 10 stocks to have negative performance over the next 10 years, but we do expect them to have lower average performance than the other about 3,000 stocks in the US over the next 10 years.
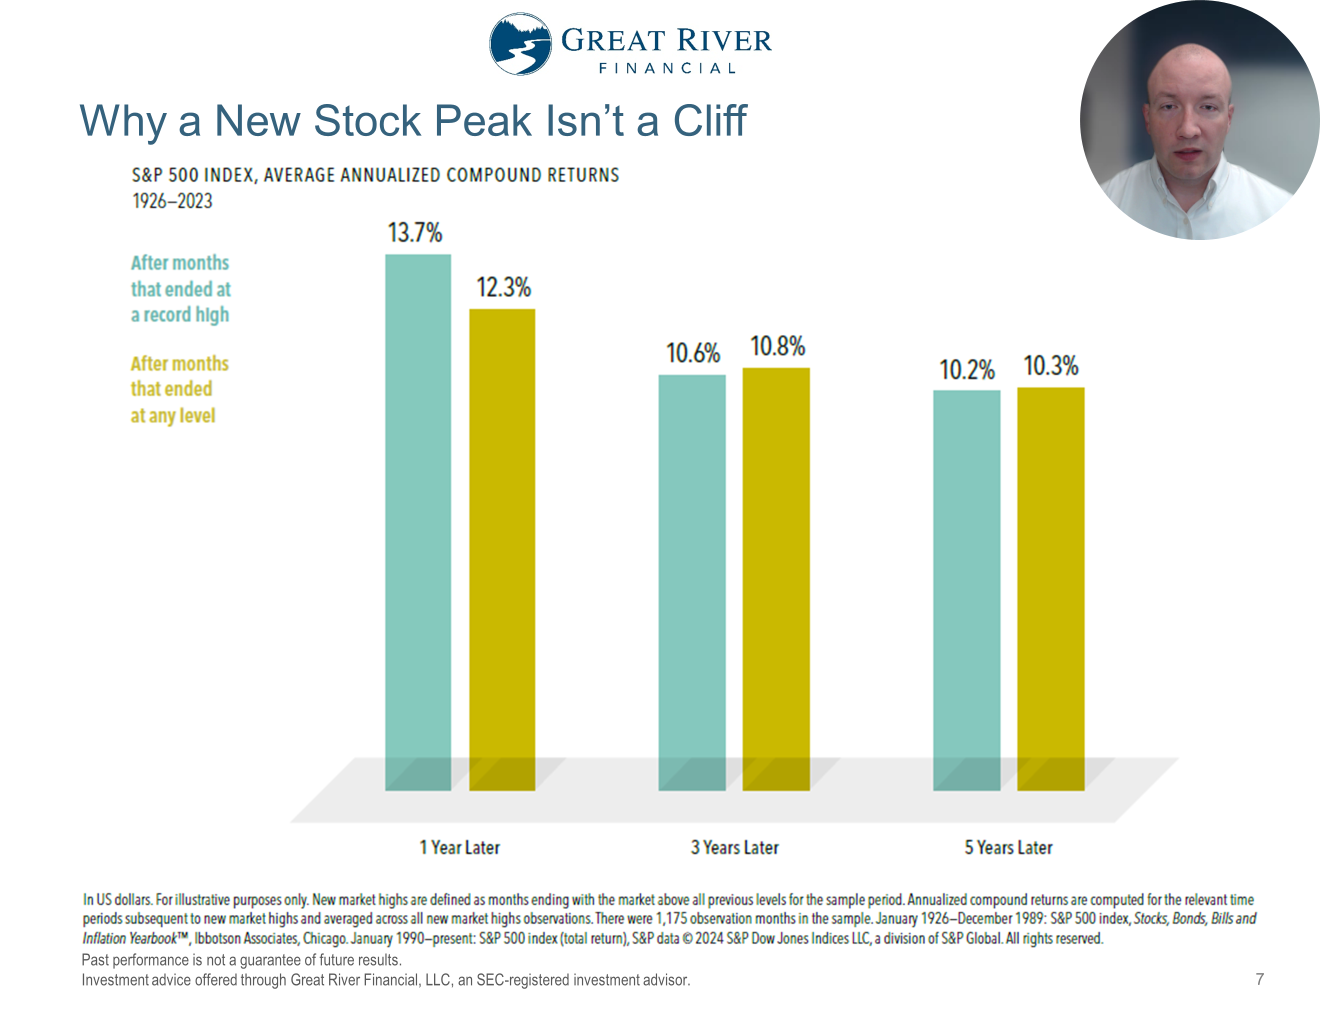
Why a New Stock Peak Isn’t a Cliff
One of the questions we get a lot is because markets keep setting new record highs does that mean stock markets are going to go down in the near future. That’s not what history has told us. When we look at the three-year average return after a new market high, which is this teal bar it’s 10.6% per year on average, whereas, after a regular market (so not a new market high month) it’s 10.8% on average over the next three years – so, very, very close. When we look at a longer period of time; when we look at 5 years it’s actually 10.2 versus 10.3, so almost identical after market high or versus not a market high. So, the idea is we should expect markets to be up over the next 5 years regardless of where the market is right now. Now that doesn’t happen every single period, but on average that’s the case.
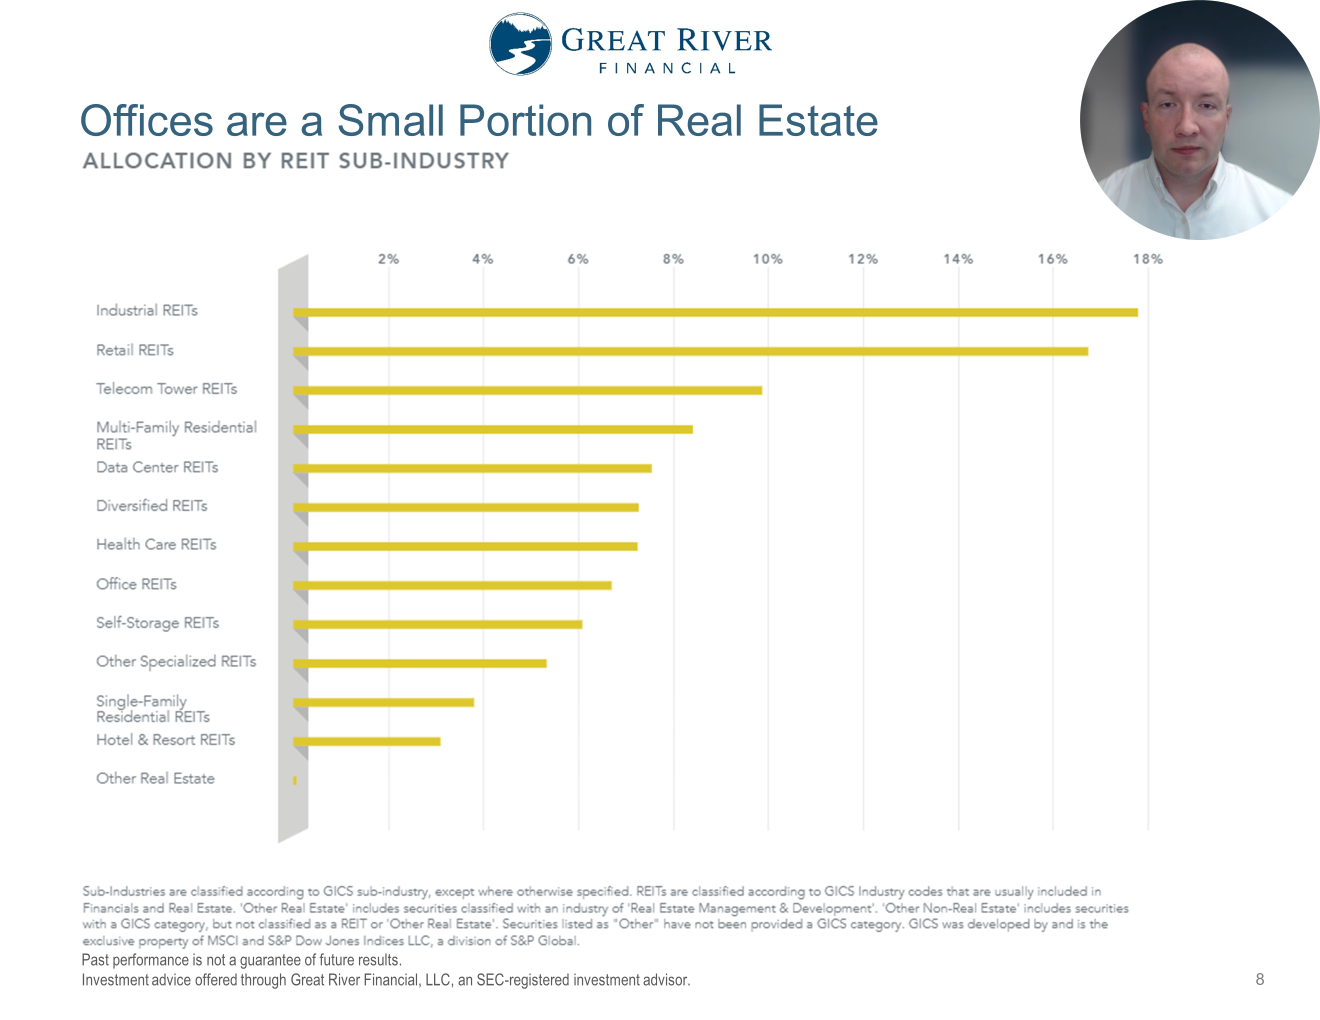
Offices are a Small Portion of Real Estate
When many people think of Commercial Real Estate as an investment they think of office towers in major metro downtown areas. Now, it’s certainly part of the market, but it’s actually a pretty small part, overall. When we look at the allocation, overall, Industrial REITs, Telecom Towers, Multi-Family Residentials (that has done well because housing is so unaffordable they’ve been able to raise rates), Data Centers, Healthcare Office REITs are all the way down here at number seven and less than 7% of the total portfolio. So even though Real Estate Investment Trust prices haven’t done that well this year I think a lot of that is due to people assuming that it’s mostly office space when much of the allocation are parts of the economy that are doing much, much better.
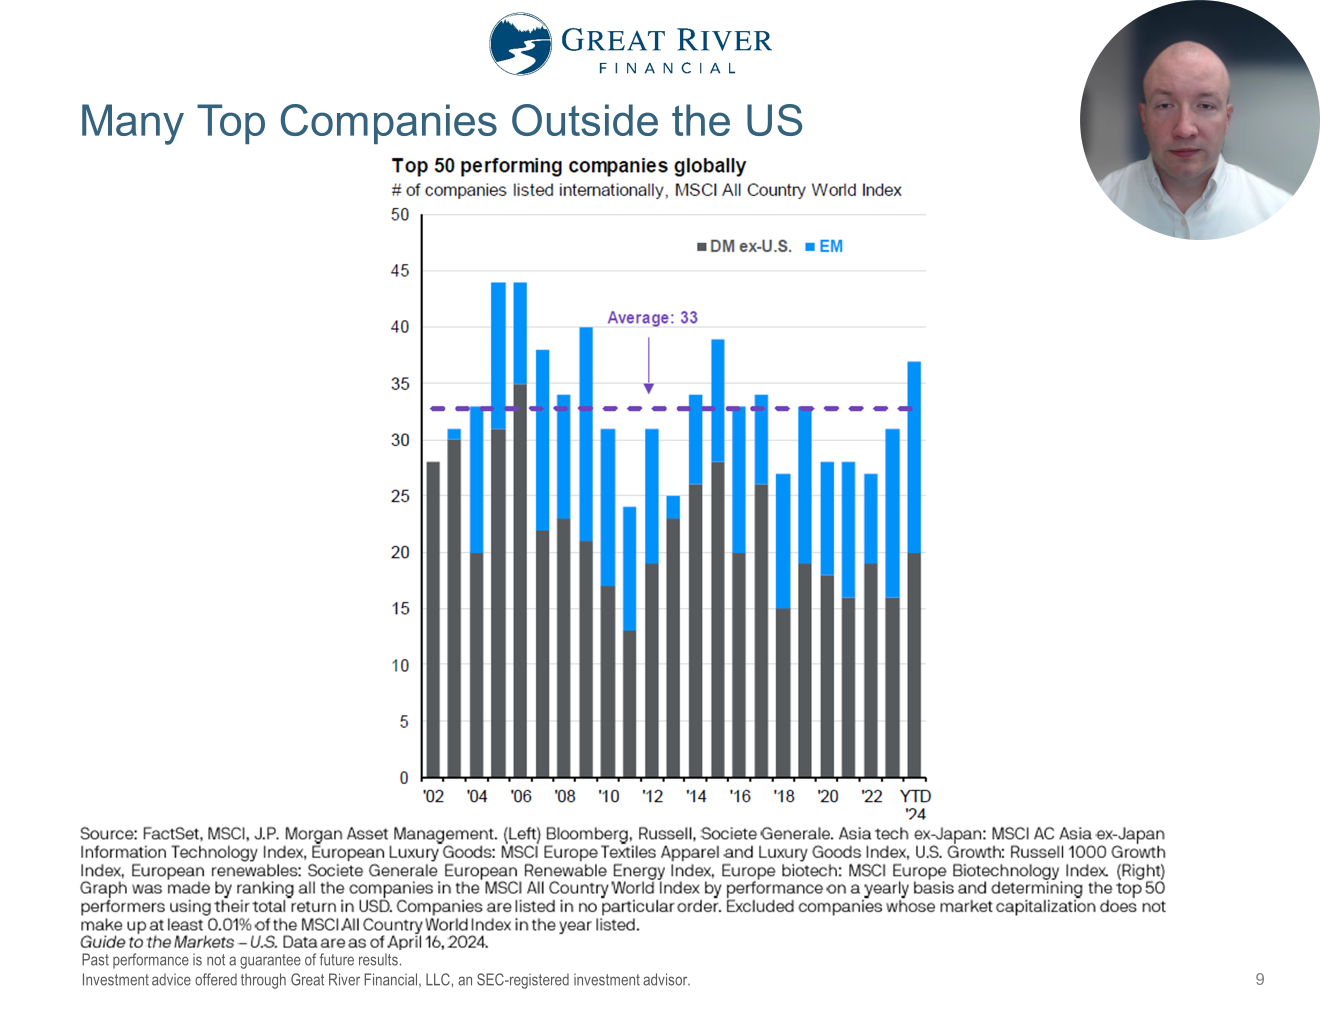
Many Top Companies Outside the US
It’s crucial to be internationally diversified in a global economy. Even though US Stocks have outperformed International Stocks over the last 20 years on average, 33 of the top 50 performing stocks during those years were outside the United States; that was during a time of US outperformance. If we have a time where US underperforms in International Stocks I expect that to be an even larger portion of the top performing companies outside the US, so it’s a key to have international diversification.
What’s Next?
We’ll continue to monitor the economy and markets and rebalance portfolios, as needed. If you have any questions, or would like to discuss something in more detail, feel free to use the Calendly link to schedule a client call. If you found this helpful feel free to share it or like it on YouTube. This is Josh Wolberg with Great River Financial – stay curious my friends.