May 2022 Market Update
Quarterly Market Summary
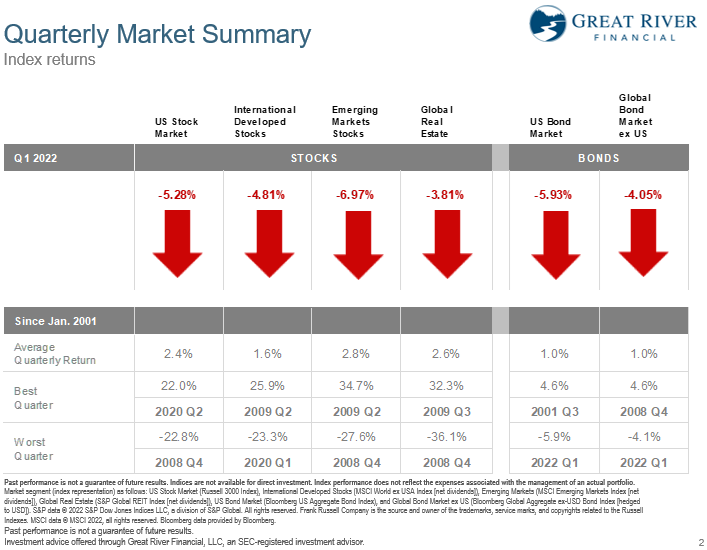
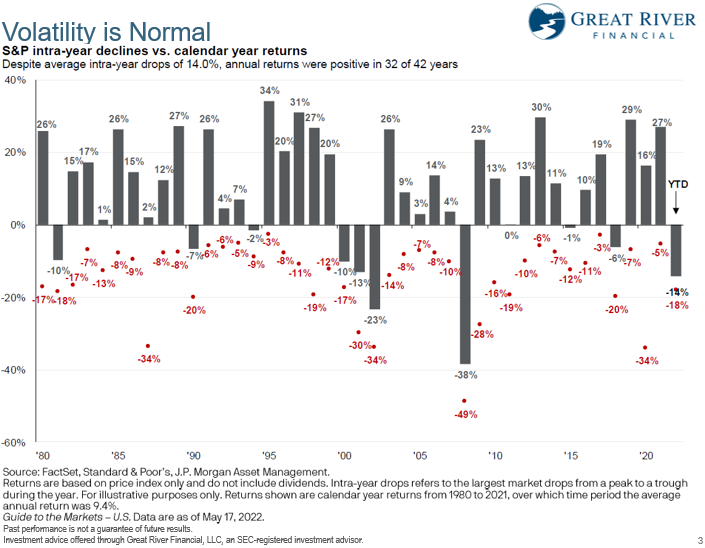
In the first quarter markets across the board – stocks, bonds, real estate, US and non-US are kind of down across the board, mid-single digits and that’s continued in April and the first part of May. It’s quite unusual for all major asset classes go down at once and all go down about the same amount, but that’s what we’ve seen in 2022, so far. In fact, if you look in the lower right corner 2022 (the first quarter of 2022) has been the worst bond performance in both US and non-U.S. stocks. At any point in the last 20 years. Now even though it’s unusual for everything to be going down, kind of at one time it is not unusual to have volatility in markets, in general. So, if you look at the last 40 plus years 3/4 of those years ended the year higher then it began the year even though the average inter-year decline during those years was actually 14%. So, I’m not saying 2022 is going to be positive by yearend, but I am saying there are many years that the market is down 14%, 15%, 20% and still ends the year higher than it started, even though it went through a trough in the middle of the year. So again, 2022 might not be a year like that, but it certainly could be, as well. So, volatility like this is not unusual to be down 10%, 14%, 15% in the first part of the year.
Long-Term Market Summary
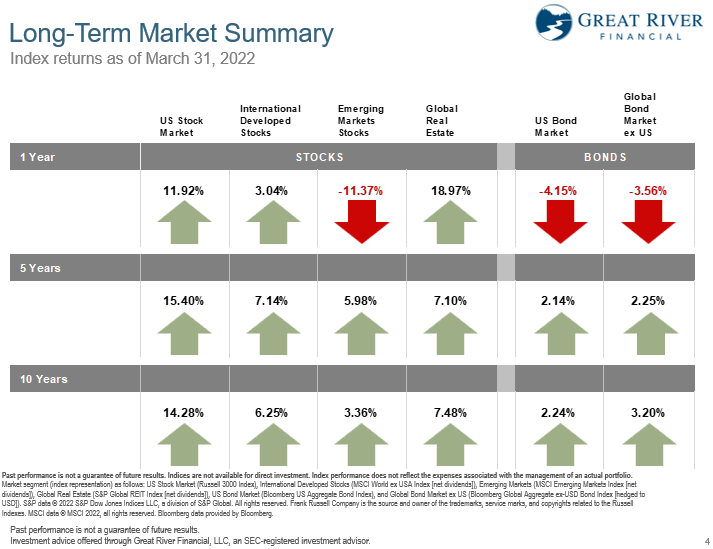
When we look longer term, when we look at the last year, global real estate has done best over the last 12 months and that’s somewhat expected in an inflationary environment. Hard assets, like real estate, commodities, gold miners, things like that companies that that mined gold or make fertilizers for commodities they’ve done relatively well.
Inflation is not good for bonds and that’s really what we’ve seen in the last 12 months. But, when we look at a diversified portfolio of all these things, even though this year 2022 has been pretty rocky and pretty much down most of the year, when we zoom out to a year, the chances are a diversified portfolio is still up during that one-year period. So, think of it as you had $1,000,000 at the beginning of 2021. Maybe you went to 1.2 and now you’re at 1.1, so depending on how you frame that, you’re either down $100,000 or up $100,000, depending on when the start of that period is.
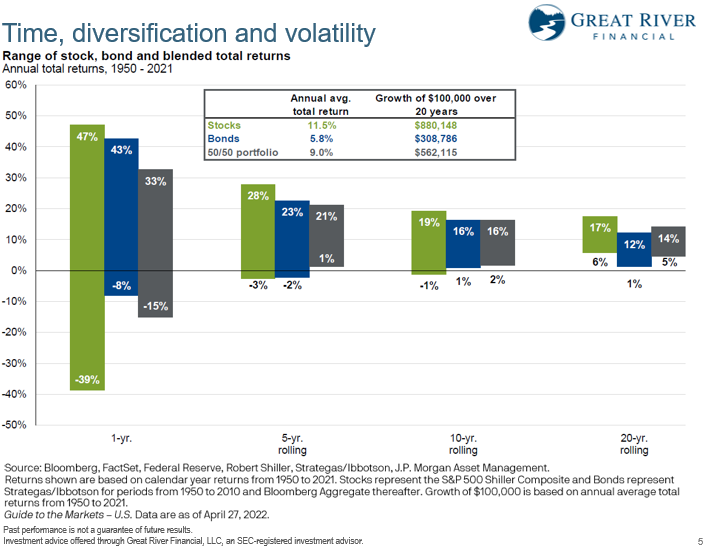
Now when we look at a longer period of time and we look at rolling five-year periods, rather than just what’s happened the last one year or five years, or whatever, on this chart, you’ll see the green is, basically, a portfolio of 100% stocks (US stocks), blue is 100% in US bonds and a 50/50 portfolio is half and half (50% stocks, 50% bonds). We look at five year rolling periods for the last 70 years. So, starting each year in the last 70 years and rolling 5 years forward. The worst performance during any of that time was up 1% on average over a five-year period. In the worst five-year period and, actually, up on average 21% in the best five-year period. So, what I’m saying here is, even though there’s a lot of bad news right now – war in Europe, high inflation, growth is slowing down a little bit – even during periods where we had the 70’s, where we had really high inflation for 10 years and low growth, where we had the financial crisis, where we had trillions of dollars too much in debt, even during those periods we still had positive returns in a diversified portfolio over a 5 and 10 year period. So, the point here is not to say that I’ll know what’s going to happen in the next five years, but we’d have to be worse than those periods in order to be negative over a longer period of time. That’s really why we need to keep calm and carry on during volatile times because better times are coming – we just don’t know when they start.
Is the US Market “Expensive”?
One question I got a lot at the end of 2021, as we were setting market highs many days, “Is the market expensive because we’re at all time market highs? It has to mean the market is going to go down”. It seems in the first part of this year that that was true. It was a true thesis. But I would also say in the 80’s and 90’s, basically, we set all time market highs most days in the 80’s and 90’s because we kept going up and up and up.
The same is true for the 50s and in the early part of the 60’s is we set all time market highs. So, when we have long term economic growth and we have long term growth in companies’ earnings markets tend to set all-time highs again and again and again without necessarily being expensive, so really the key to think about “Is a market expensive or cheap?”, is relative to what they’re earning today in profits – is it expensive or cheap?
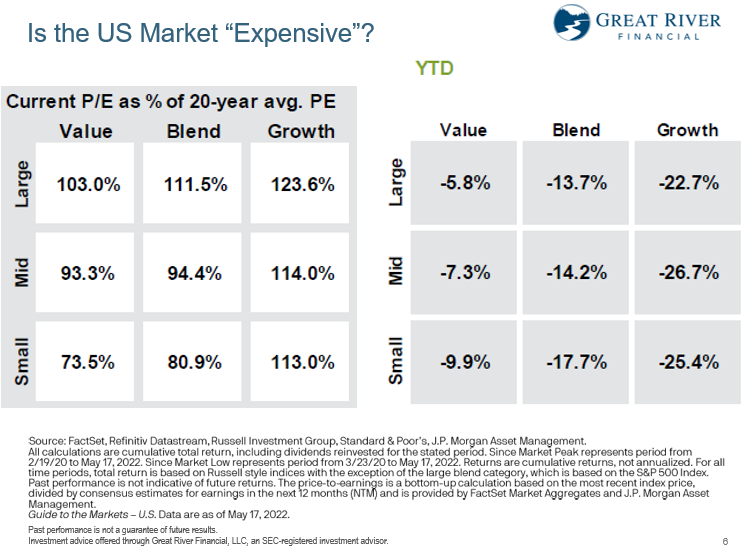
What this chart on the left is, is basically PE ratio (price to earnings), so the price of the stock divided by the earnings per share. The higher that number the more expensive stock is relative to what it’s earning.
Time, diversification and volatility
“Is it above its long-term average?”, so a 20-year PE ratio on average, or is it below that long term average? You’ll notice small value is about 26 1/2% undervalued compared to its long-term average. So, actually you can buy earnings really cheap in the small value part of the market and earnings in companies that have earnings in the large growth part of the market is maybe still a little overpriced and you see that in actual performance. So, if you look on the right as year to date performance growth has done much, much worse than value has. Value is down less than 10%, growth is down more than 20% across the board – large, mid or small. You’ll notice Netflix is down over 65%, Facebook’s down more than 35%, so far. The DFA funds that we use in the stock market are index funds, but they are index funds that overweight the parts of the market that have longer average rates of return. So, value tends to overperform growth over long periods of time. Small companies tend to outperform large companies over long periods of time. So, DFA funds because they own more in small value than the index does, and less in large growth than the index does, haven’t been beat up quite as much as a regular index fund. So, they’re down roughly 3% less over the last six months than a regular index fund, and it’s partly because of this value growth and large, small component to it. The US market – parts of it are a little bit expensive, but there are some parts that are actually a really good deal.
Is the Global Market “Expensive”?
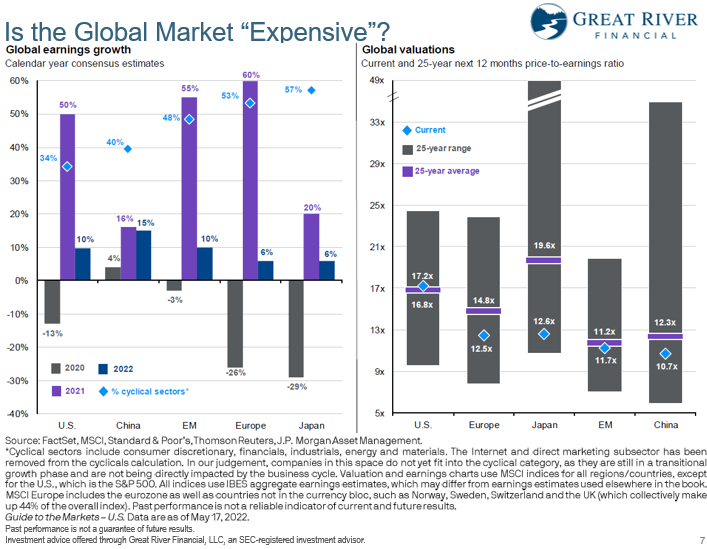
If we look globally – if we ask the same question about PE ratios and what’s cheap versus what’s expensive – over on the right the gray bar is the range of PE ratios over the last 25 years in major countries. So, Europe as a region, Japan, China, emerging markets, the purple bar in the middle is the average PE ratio over that 25-year period and the blue diamond is what’s the current PE ratio. You’ll notice across the board the US is probably right on its historical average for how expensive the stock market’s averagely priced. Around the world Japan is something like 35% below its average price.
China is something like 20% below its average price. Same thing for Europe. So, when we look around the world, it doesn’t look like stock markets, in general, are expensive. On the left you’ll see the purple bar and the blue bar is basically earnings growth of companies in these countries in 2021 is purple and then the dark blue is 2022. Three quarters of companies so far this year in 2022 have actually beat their earnings estimates, and that’s really what drives the long term performance in stock market – how much are companies earning year over year. What are their profits growing by? They’re pretty much growing around the world right now. So, I don’t see the stock market as really expensive.
Leading Economic Indicators
It’s almost as if the market is pricing in, it knows there’s going to be a recession, or at least it assumes there’s going to be one. I don’t know if I necessarily see that when I look at the data either. The blue line here is leading economic indicators, and when it’s above 0, it tends to be economic growth after that period in the next 6 to 12 months. You’ll notice this is a 20 plus year graph and the blue on the far right is, basically, we have readings even though it’s come down from the very high, like when we first got vaccines first started to really come out of the pandemic.
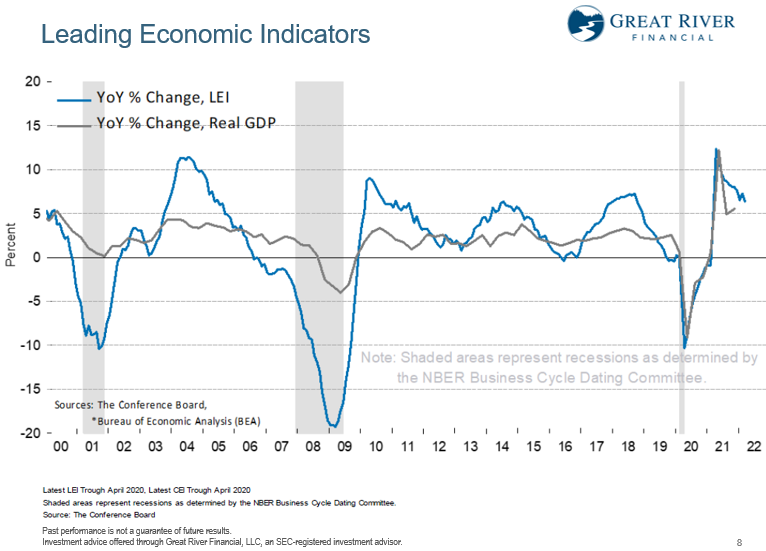
The blue line is actually higher readings now than much of the last 20 some years, so it looks like we’re going to have economic growth. Now could that change? Of course, it could. But even if we had a recession, that doesn’t necessarily mean that markets are going to go down. We’ve had times when markets go up and when there’s a recession, typically not, but sometimes it happens. And if there isn’t a recession, if there’s better news than what the market fears right now, we could actually see prices on stocks or below their long term averages, at least in much of the world.
We could actually see a really big rebound if we get some good news at some point. Good news out of Russia, Ukraine. Good news, out of inflation or anything else, economic growth, supply chain, supply chain issues getting resolved over time.
Inflation
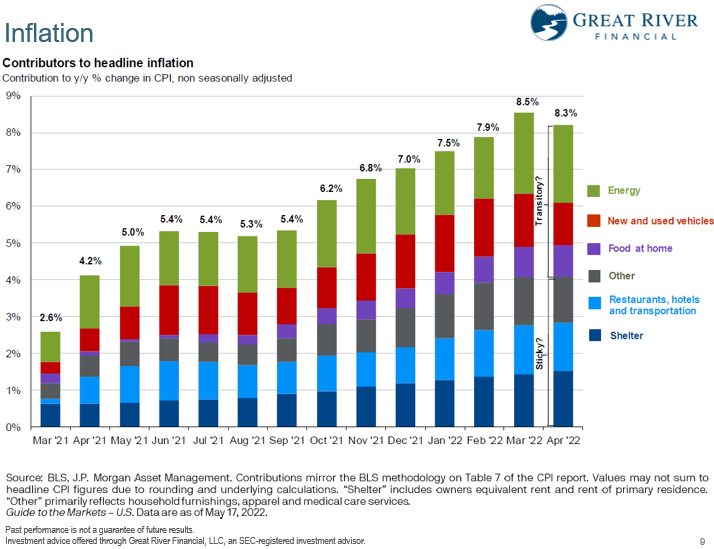
Inflation is something I hear a lot of questions about as well, and you’ll notice inflation started a while back. It didn’t just start in the last few months, but it has kind of hit a crescendo at least in March of 2022. It came down to April 2022. The real fight here between what’s going to happen with inflation in the future is what percentage of inflation is transitory. It’s things like supply chain shocks from the pandemic. It’s war shocks or debt shocks when it comes to food and energy and what is going to be long term sticky and it’s probably some combination of the two. It’s probably not all one or all the other. One thing to keep in mind with inflation is if we went from $2.50 on gas to $4 on average and we stay at $4 for the next 18 months actually, energy inflation in the next 12 months would be 0 if we stay at $4. It could be negative if we go down to $3.50, so we could have some positive effects of inflation over the next, say 6 to 12 months, simply because even if prices just stay where they’re at because at some point year over year, it didn’t grow as much. So, we saw the first little bump down in April. It wasn’t as much as people had hoped, but it could be poised to have lower inflation in the future than what we’ve had the last six months, and that would be good news for markets – both bonds and stocks. So not calling for that, but there is a potential silver lining in this cloud.
Investing in Volatile Markets
So how do we invest in volatile markets? So, first thing is thinking about designing a portfolio before markets are volatile, because they’re volatile kind of all the time, right? To mimic what the client needs. So, if they’re young, they’re still 20 plus years away from retirement they might have 100% of their retirement assets in stocks and real estate. But if they’re in retirement, chances are they have something more like 40 to 60% in stocks and the rest in bonds and cash. So, what we do for people who are in retirement and they’re taking money out of their accounts every month:
So, let’s say they’ve got $1,000,000 and taking $4,000 out a month, so $48,000 a year. We’re keeping them about six months’ worth of extra cash in in that account. So, about $24,000. What will happen over time is dividends and interest will come into the account and they will replenish the cash and then money will go out every month to their checking account for lifestyle spending. We manage enough cash to give us a buffer for a number of months, and then we also manage enough bonds to give them a buffer (bonds are more volatile than cash, but a lot less volatile than stocks), so that’s kind of in that intermediate spending from 1 year to, say, 10-15 years’ worth of bonds so, the key is having that allocation right for your specific situation and going into markets so that we don’t have to sell stocks, or we don’t have to sell bonds, when they’re down significantly.
How do we invest?
- Buffer of cash/bonds for short/intermediate term cash flow needs
- Dividends and interest: reinvest or leave in cash?
- Rebalance
- Roth conversions
- Getting more out of your cash (that isn’t in your emergency fund)
- Extra payments on debt with variable interest rates
- I Bonds
- Dollar cost average into diversified portfolio
The idea here is we have enough cash to weather the storm for several months, and then as dividends and interests come in, and because bond prices are lower, interest rates are higher, which means the interest coming into your account from bonds are actually going up. Which is good news because it means that replenishes the cash buffer faster.
If you’re in accumulation, we’re reinvesting those dividends and interest in whatever part of the market is cheapest relative to how much percentage you have in your overall portfolio. There haven’t been a lot of opportunities to rebalance this year, unfortunately, because stocks and bonds have kind of gone down lockstep, but we’re always looking for opportunities for when stocks go down and bonds go up or bonds go down and stocks go up to buy low and sell high in whichever capacity, so we’re always looking for that. There just haven’t been a lot of opportunities so far in 2022, which is unfortunate.
Roth Conversions
So, if we’re doing partial Roth conversions for you, or we’ve talked about it once you hit the first few years of retirement, it might make sense to take money from your tax deferred IRA and you’re in a lower tax bracket your first few years of retirement a lot of times before you’re getting full Social Security, and take those IRA’s and convert a portion of it to Roth to have the rebound in the market happen in the Roth. Typically, we do our Roth conversions kind of towards the end of the year, but when there’s a big downturn in the market, say in the first half of the year, sometimes we’ll do some of those Roth conversions in the first half of the year. So, either give me a call if it’s something that we typically do or I’m going to be making a list here and checking it twice over the next few weeks and months to give you a call about possibly doing Roth conversions, or at least a partial Roth conversion part of your annual conversion in the first part of the year as markets are down.
The other thing is getting more out of your cash, so this is cash on the sidelines that is not in an emergency fund.
So, let’s say you’ve got $60,000 in cash you want to keep $30,000 for emergencies. Keep that in cash, right? But the other $30,000 what can we do with that in an inflationary environment when markets are choppy? First thing I would consider is if you have debt that is based on variable interest rates. As the Federal Reserve increases short term interest rates, that means HELOC payments (home equity lines of credit), credit cards, things like that the interest is going to go up, so it might make sense to make extra payments, or pay those off, as soon as possible in this environment.
If you don’t have any of those, the next thing I would think about are I Bonds. So, I Bonds are something that a lot of people haven’t heard of. It’s not an investment I can buy for you. You can only buy these (they’re savings bonds) directly from the US Treasury that are designed to keep up with inflation. So, when inflation is high, the rates on these are actually pretty high. You can learn more at www.treasurydirect.gov. You can put $10,000 per person per year. So, my wife and I we can each put in $10,000. She has an account. I have an account. They must be held at least a year, so think of it as one year commitment. You buy it in May of 2022, you can’t touch the money until May of 2023, which is why you don’t want to put money from your emergency fund in here all at one time. After that you can get to it anytime. The interest rates reset every six months. So, if inflation comes down, the interest rates on these will come down in the future, but it’s locked in for six months. Right now because the last six months inflation has been really high, the rates on these are over 6%, or I’m sorry, over 9% in for the next six months. It’s something that you can learn more about at www.treasurydirect.gov or give me a call and we can talk through it.
If you’ve done those first two things, the other thing is if you have cash above and beyond that is to consider dollar cost averaging into a diversified portfolio. One of the things I heard a lot at the end of 2021 is “Josh, I got a bonus. I’m thinking about investing it, but I don’t know if markets going to go down and I don’t want to put it in right before the market goes down”. One of the things I talked about at the time – always talk about, even if markets are going up and there isn’t apprehension about putting money in the markets at that time, is if there’s a big lump sum is to consider doing it over a period of time rather than all at one time. So, if somebody has $30,000 in cash above and beyond I Bonds and paying down debt, rather than doing that all at one time because markets could go lower from here, but they could also go higher. Rather than waiting until you know when we think the bottom is going to be, maybe it makes sense to break it over a few months’ time. Let’s say if it’s $30,000, you could do $5,000 a month for six months. You could do $10,000 a month for three months, but something along those lines to say we’re just going to regiment it on the 15th of every month. We’re going to put money in and we’re going to buy whatever is cheapest down on those days to rebalance the portfolio and it gives us an opportunity. It’s kind of the Goldilocks sort of way to get into the market. If markets go down, you’re going to buy it more and more on sale. If markets go up, then you’ll have had some of that money invested as markets rebound. Give me a call if you want to talk through that, alright?
What’s Next?
So, what’s next? Continue to monitor markets and the economy as we always do, make adjustments to your portfolios, as needed. We’ll do rebalancing, manage cash to make sure that you have enough for your distributions.
If this is helpful, feel free to like it on YouTube and or share it with others that might find some of the data that I shared with you helpful.
Thank you for watching this is Josh Wolberg with Great River Financial.
Stay curious my friends.