January 2024 Market Update
Quarterly Market Summary
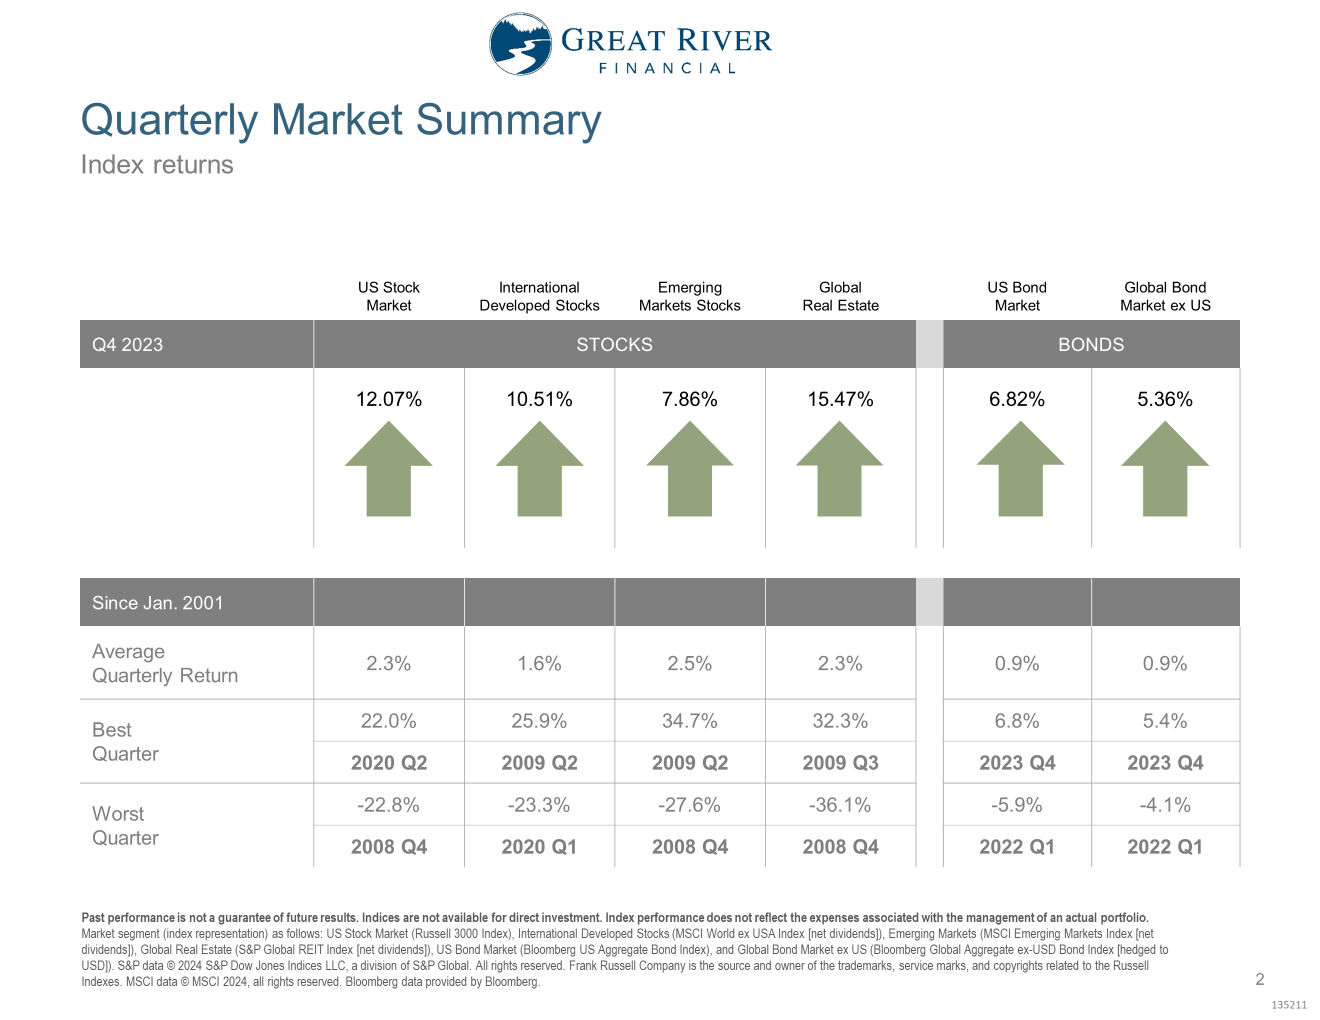
2023 started rather flat, but that really turned around in the fourth quarter as stocks and bonds, both in the US and around the world, gained between 5-15%.
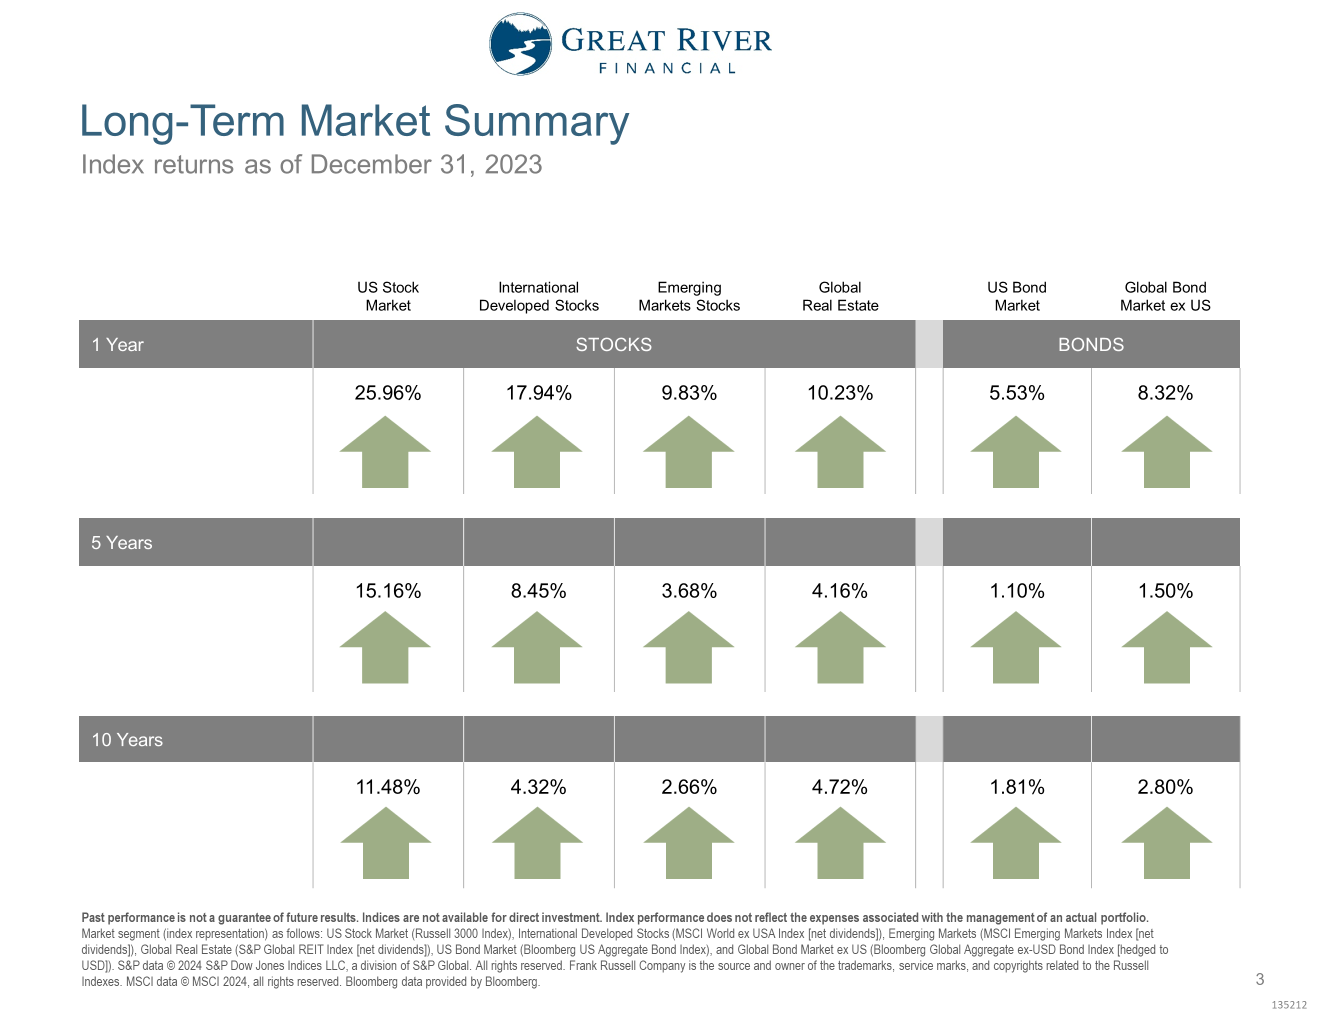
When we look at the full year 2023 stocks were up between 10-26% and bonds were up more than 5%. When we dig a little deeper into stock performance in the US in 2023 there’s one outlier and that’s large growth – it was up almost 44% where everything else was up 10-27%. Still great performance, but not like large growth. That was driven primarily by seven large technology companies that have been nicknamed The Magnificent 7 – Google, Amazon, Apple, Facebook, Microsoft, Nvidia and Tesla.
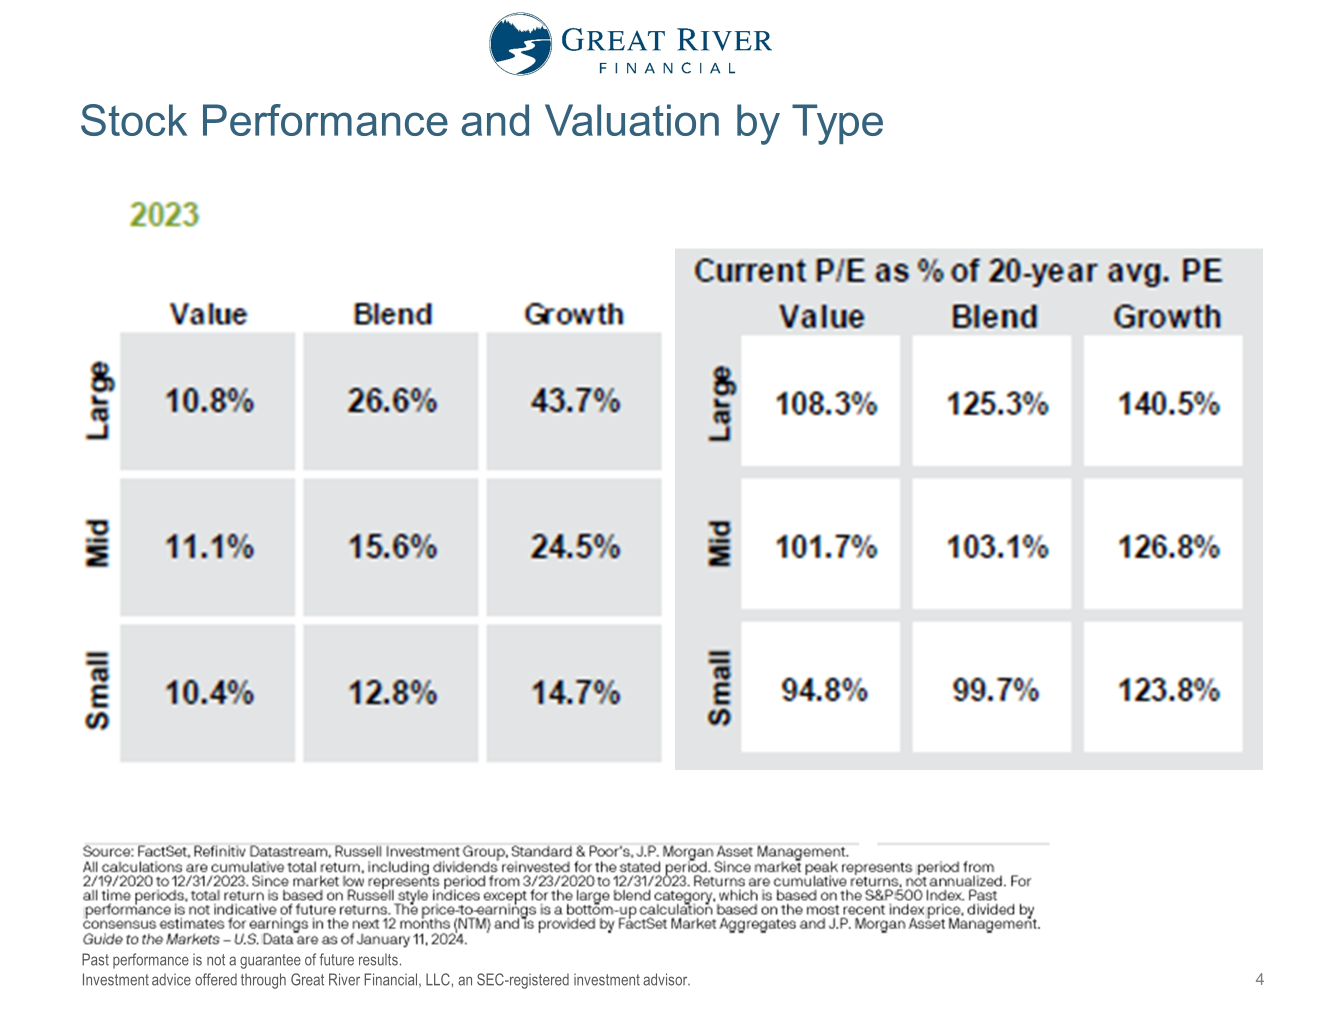
Now I don’t necessarily expect this outperformance to continue into 2024 and beyond, mainly because prices have gotten a little in front of earnings. Over on the right here we have the current price to earnings ratio as a percentage of its long-term 20-year average price to earnings ratio. So, numbers above 100% are generally considered to be a little bit overpriced and things below 100% are considered on sale or underpriced. Now this doesn’t mean that large technology stocks are going to have negative performance in 2024 or 2025, but I do expect them to have lower performance than small value stocks simply because their prices are higher relative to their earnings unless technology stocks have much higher earnings growth than is expected over the next few years.
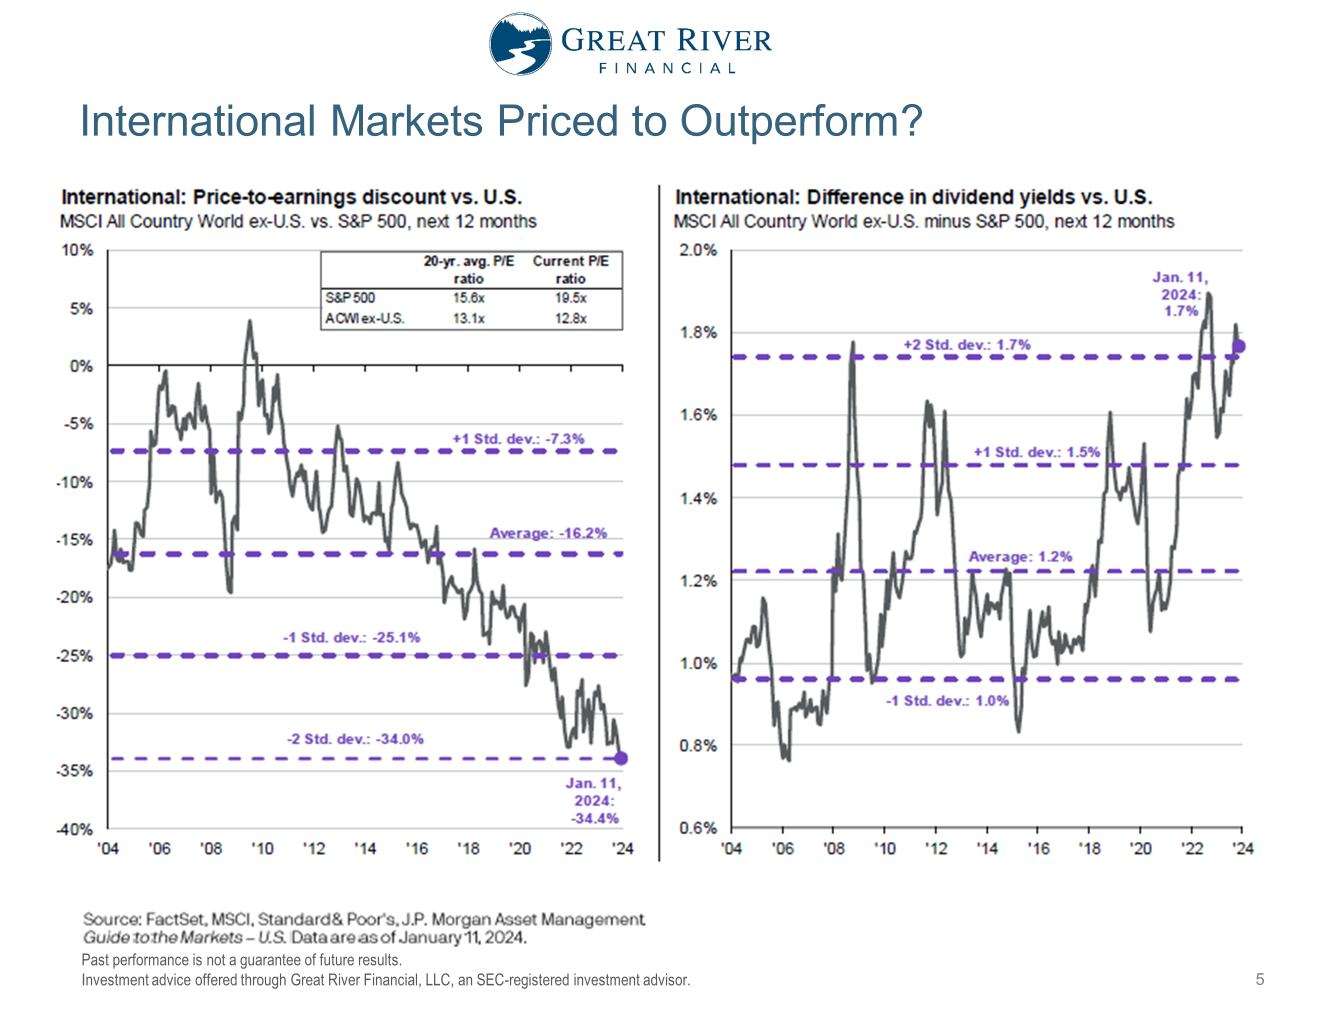
One area of the markets that we think are priced to outperform are international stocks versus US stocks. This graph on the left shows the price to earnings ratio for international stocks versus US stocks and you’ll notice it goes back 20 years all the way back to 2004, which is hard to believe is 20 years ago, but this is the largest discount of price to earnings ratio on international stocks versus US we’ve seen in over 20 years, so they’re on sale compared to US stocks. Now, we don’t necessarily know when that’s going to turn around and international stocks may do better than US stocks, but we do get paid to wait in the meantime. On the right we have the dividend yields of international stocks minus US dividend yields, which means we’re getting paid about 1.7% more on dividend yields right now in international stocks than in the US.
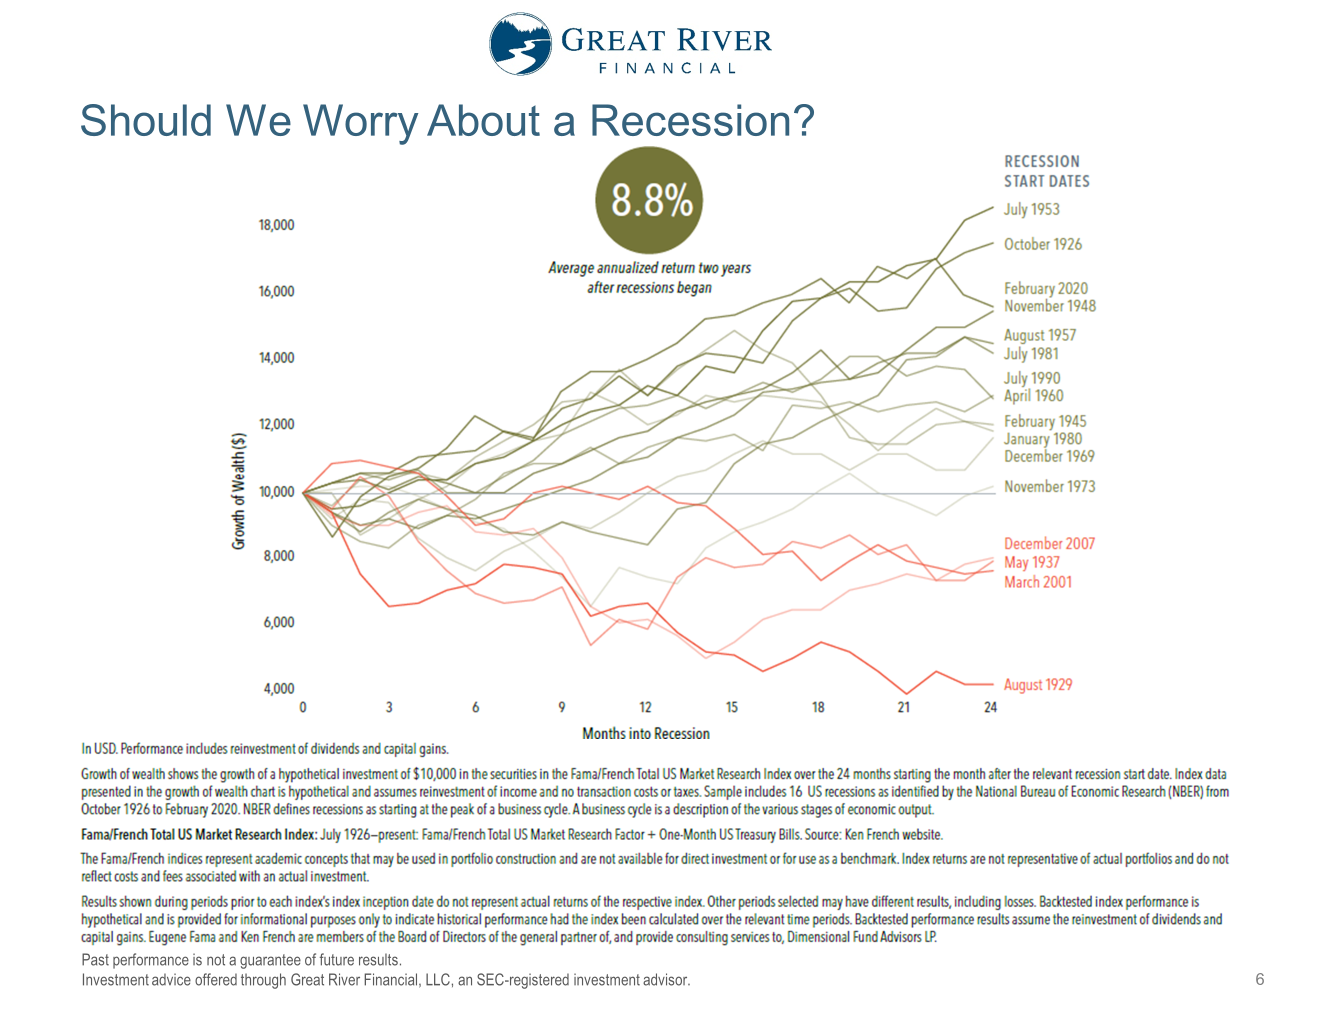
Should We Worry About a Recession?
One question we commonly get at the beginning of years is “Will there be a recession this year, and if so, should we change our investments in any way?”. This graph shows the stock market return after the beginning of every recession since 1929 until now, so 16 recessions in all. What’s surprising to many is the average annualized return the two years after those recessions began is actually almost 9%, which is pretty close to long-term average of stock markets. So, whether we knew there was a recession coming, or not, wouldn’t necessarily give us enough information to know whether stock markets are going up or down. What’s more important than knowing whether there’s going to be a recession this year, or assuming there’s going to be one this year or not, is what we would do in the case of a lowering stock market or a stock market that goes much higher. If stocks come down, more often than not, bonds will go up as a result of lower interest rates and lower inflation. So, if stocks go down – bonds go higher, we’ll sell bonds high, we’ll buy stocks low. If stocks do really well a lot of times that means there’s higher inflation and higher interest rates, that means bonds don’t necessarily do well. In that case we’re going to sell stocks high and buy bonds lower that are yielding higher interest rates.
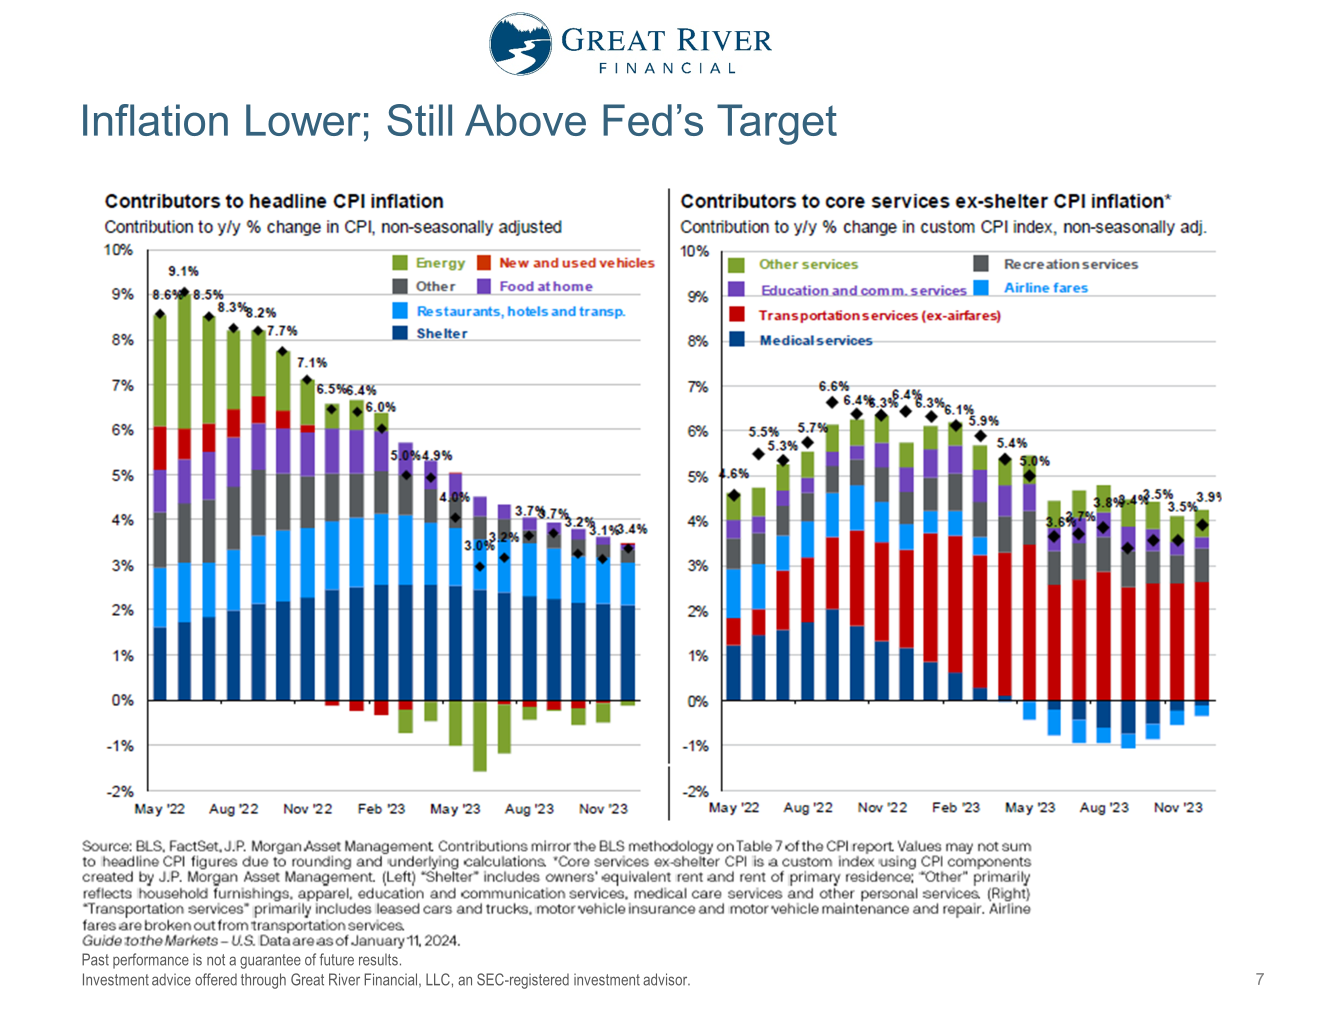
Inflation
Which brings us to inflation, which is much better than it was 18 months ago, but still not quite where the Fed’s long-term target is of 2-2.5%. If you look back in mid-2022, on the graph on the left, total inflation was a little over 9%. It’s come all the way down; in the last 6 to 7 months it’s been between 3-3.7% – kind of going up and down, but kind of in that range over time. You’ll notice even parts of these green bars below the zero line are actually deflation in energy cost for much of 2023. The one part that’s still sticky here is this blue part, which is shelter cost, and it just takes a long time for us to build more homes, for us to build more condos and apartments, and things like that. So, that’s going in the right direction, it just takes longer than the rest of it. Over here on the right, when we look at services inflation – most things have normalized the one kind of sticky part here is red, which is transportation services -that’s things like car insurance, mechanic services to fix your car. So, we’ve made a lot of progress here in the last 12 to 18 months, not quite where we want it to be, but I expect in the next 6 to 12 months it’ll be close to 2% again.
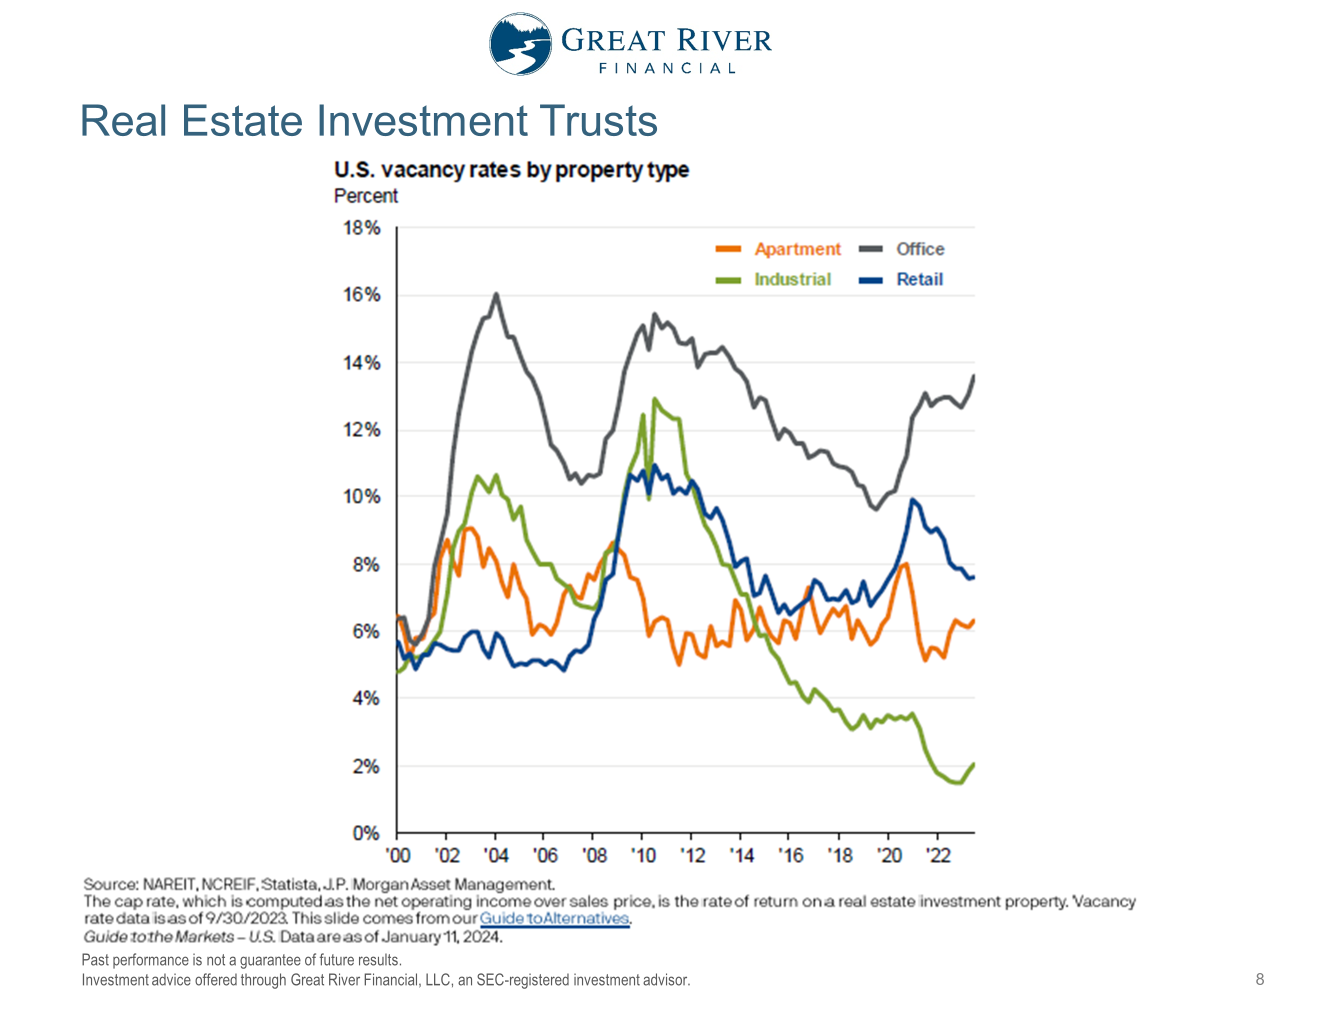
Real Estate Investment Trusts
With more and more employers going to a hybrid or fully remote workforce there’s been questions about whether we should continue to have Real Estate Investment Trust (REIT). The first thing I’ll say about REITs is they’re not all office space. When we look at the four major categories: apartments, office, industrial and retail, three of the four of them, and particularly industrial, have below average vacancy rates for the last 20 plus years, and even office space has lower vacancy rates then at the peaks we saw in the early 2000s and during the financial crisis. The other reason why I think REITs make sense long term is when interest rates fall, they tend to do well because most of these properties are financed and when interest rates go down their profits net of interest costs actually go up. So, if interest rates go down it’s good for this this part of the market. Then lastly, long term real estate investment trusts have been a really good diversifier and a good protection against inflation long term, so I still think they make a lot of sense.
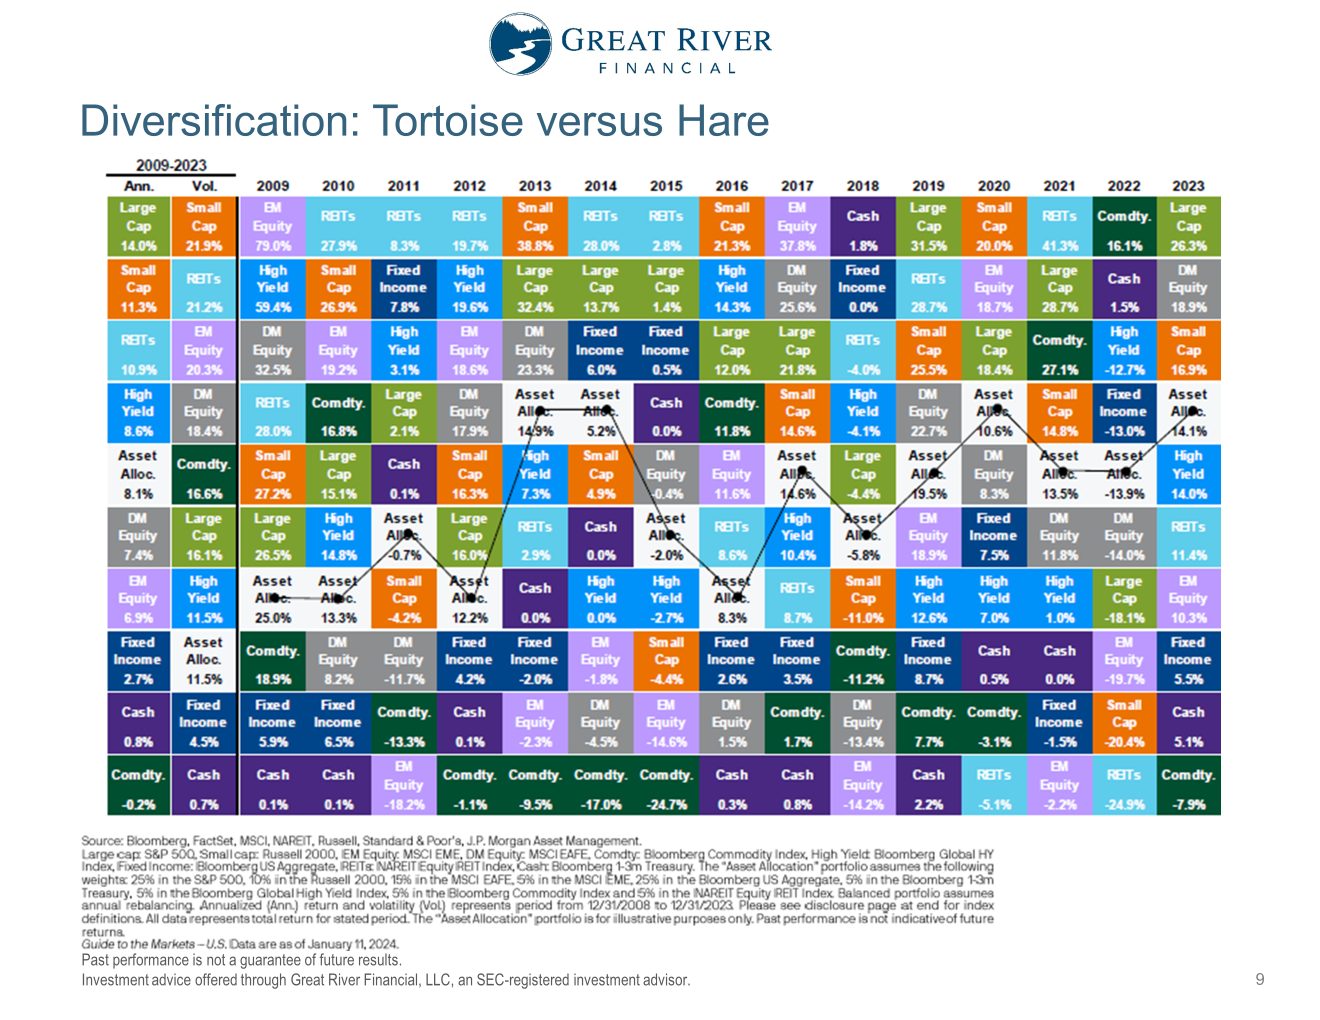
Diversification
Lastly, it’s important to remember the long-term benefits of a well-diversified portfolio. This chart shows us asset class returns ranked from best to worst in each individual year from 2009 all the way to 2023, or 15 years. When we look along the top at the best performing asset class in each individual year it changes a lot. The other thing that’s important to note is that it’s hard to predict what will be next year’s best performing asset class; same thing along the bottom, the worst performing asset class tends to change over time and it’s hard to predict who will be next year’s lagered. What’s easier to predict is that the asset allocation, which is a mixture of all of the different asset classes, tends to be in the middle over time. Where it really shows up is when we look at long-term averages. The long-term average of the diversified portfolio is actually above the average of each of the individual components; what’s even more important is the long-term volatility, or standard deviation, is actually third lowest amongst all the different asset classes even though it has above average returns during that time. That’s really the benefits of long-term diversification over time, so we don’t have to be right about markets we just have to react correctly to markets.
Looking Ahead
So, what’s ahead in 2024? We’re going to continue to monitor markets in the economy, we’re going to make adjustments to your portfolio, as needed. If you found this helpful, share it with somebody or like or subscribe on YouTube. Thanks for watching. This is Josh Wolberg with Great River Financial.
Stay curious my friends.